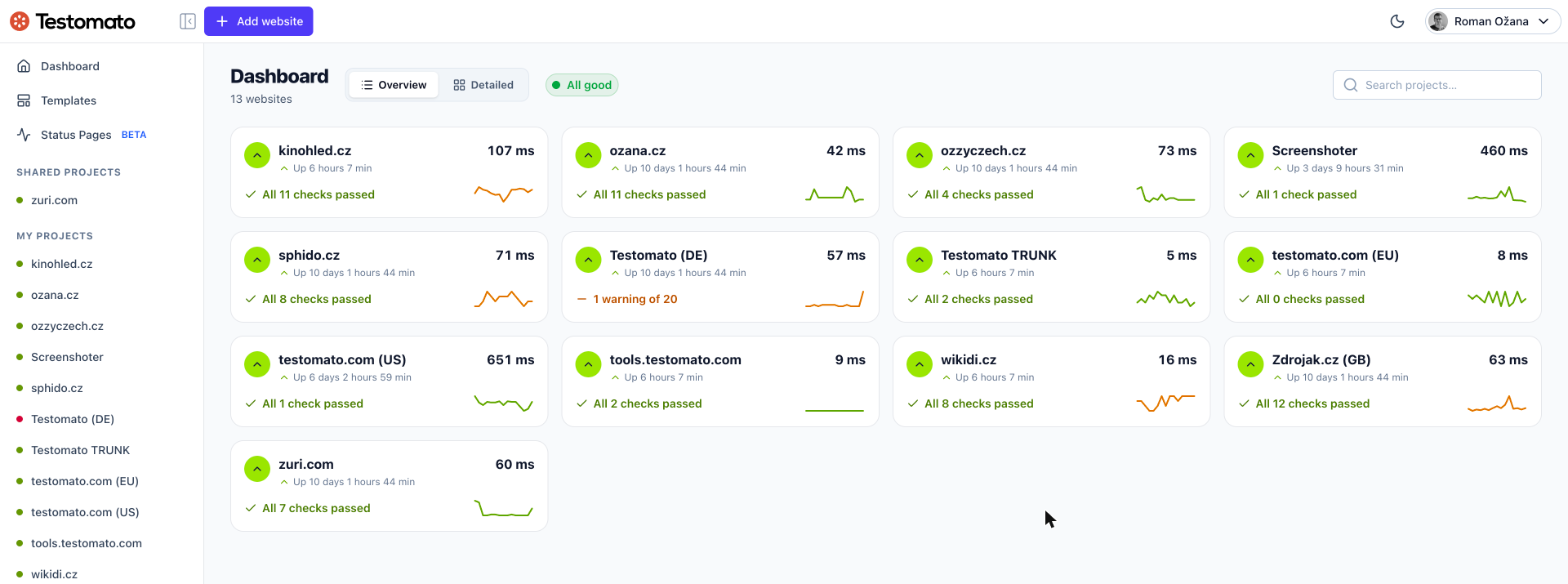
Testomato Dashboard
Dashboard is meant to help you get a basic overview of what's going on in your projects in a quick way.
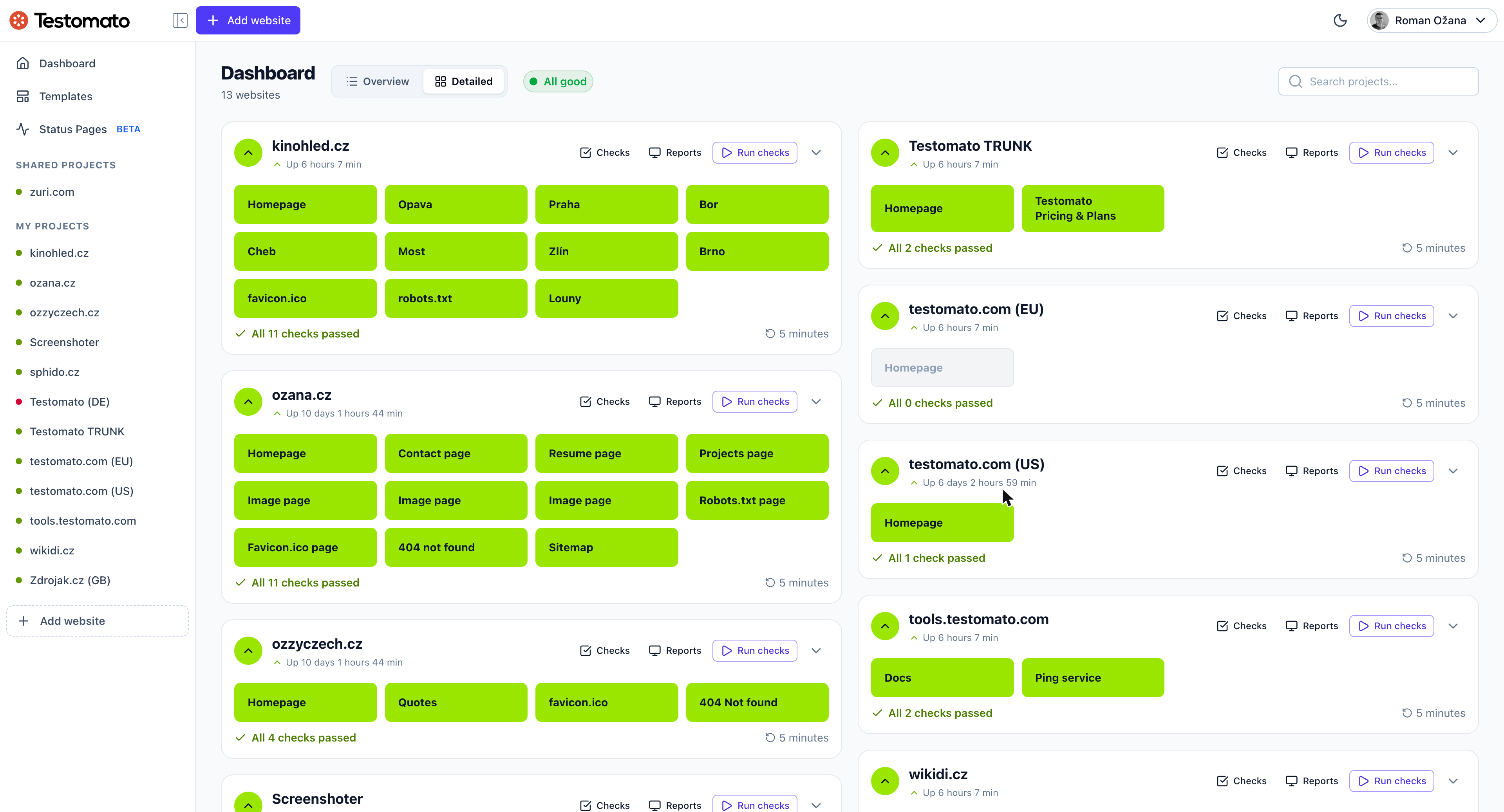
When you sign in to Testomato, we want you to be able to know if there are problems the minute you see your dashboard. That's why boxes will change color according to the status of each check.
Open selected Project
Section titled “Open selected Project”By clicking on Project Name or Checks button.
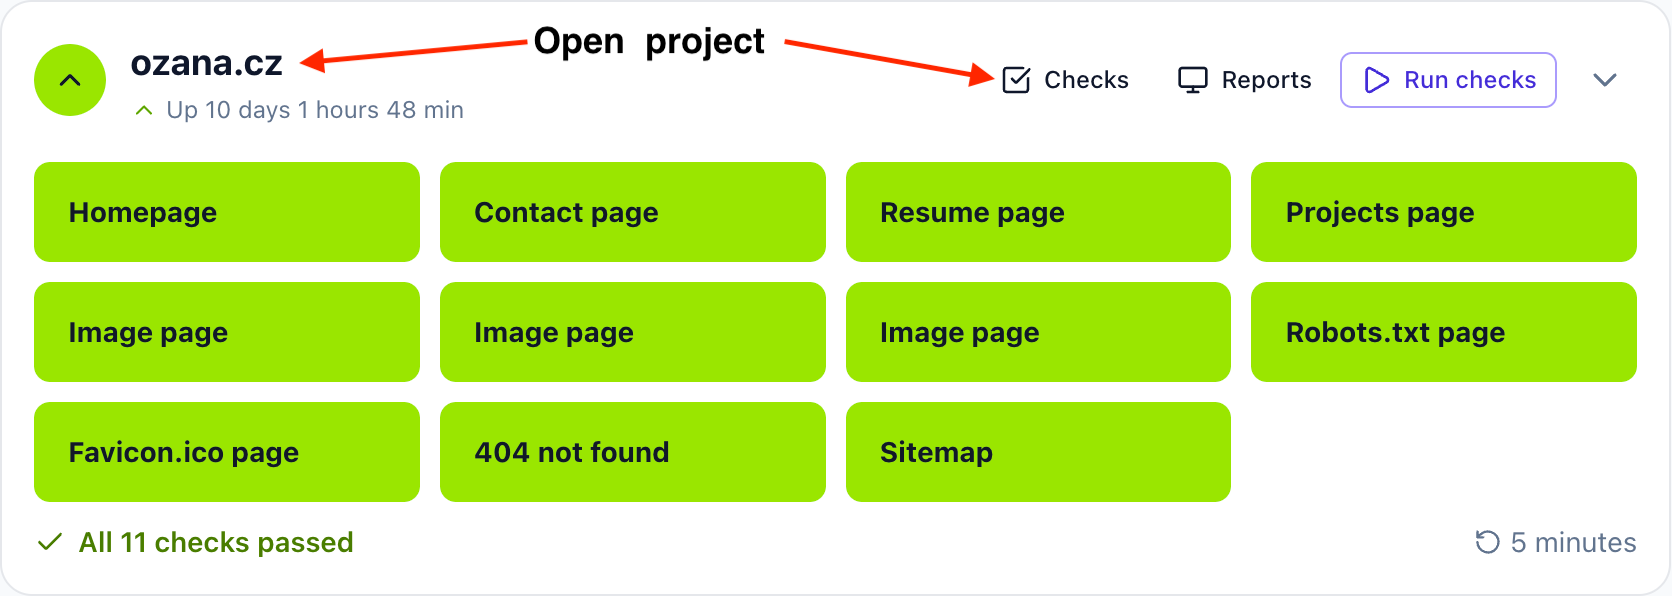
Check colors
Section titled “Check colors”Each check is a box, coloured by the result of its last run:
- Green: This page passed all checks.
- Red: This page failed some checks.
- Orange: Testomato could not download the page — usually a timeout.
- Gray: The check has been turned off.
- Dashed outline: The check is new and has not produced a result yet.
- Spinner: The check is running right now.
Under the boxes, each project sums its checks up as All 11 checks passed, or
1 failing · 2 warning of 20 when something needs attention. The figure carries
an icon as well as a colour, so it stays readable if you don't distinguish the two.
Overview and Detailed
Section titled “Overview and Detailed”The toggle next to the Dashboard heading switches between two layouts. Detailed gives every check its own box — that is the view in the screenshots above. Overview collapses each project to a single row with its current response time and a response-time trend, which is the more useful one once you monitor a lot of sites.